Power BI overload: when more dashboards mean less clarity


Data promised decisions, but delivered dashboard chaos. When reports multiply endlessly, dashboards gather dust despite their visual appeal, and trust evaporates as numbers clash and definitions vary – even with powerful tools like Power BI, a deeper issue is lurking. Management confidence wanes as the promised clarity remains elusive.
Many organisations in the recent decade(s) have adopted Power BI or a similar tool, seeking data clarity and informed decision-making. However, a common scenario unfolds: a proliferation of reports, datasets disconnected from reliable sources (often flat files), and dashboards that, despite their visual appeal, suffer from low usage or outright mistrust.
Numbers don’t align, definitions vary, and management confidence wanes. This isn’t usually a failing of Power BI itself, but rather a symptom of underlying issues in data structure, governance, and adherence to established Business Intelligence (BI) and Data Warehousing (DW) best practices. We often see companies struggling with problems that have clear solutions based on proven best practices.
Navigating BI maturity: common pain points
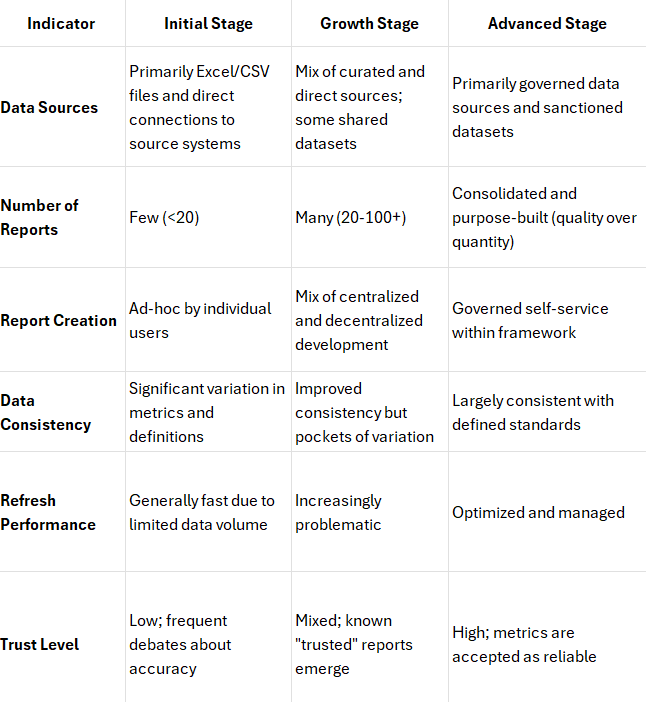
Organizations exist on a spectrum of BI maturity. Recognizing your stage helps identify specific, often predictable, challenges:
1. The initial stage: ad-hoc analytics and spreadsheet feeds
- Characteristics. Power BI often connects directly to operational systems or, commonly, flat files (Excel, CSVs). Reports are built independently, often by different users or departments.
- Core Challenges. Rampant inconsistency in metrics and definitions (“duelling dashboards”). High manual effort for data preparation leading to errors. Lack of historical context or integrated views. Difficulty establishing a single version of the truth, leading to low user adoption and trust issues from the outset.
- Expert Observation. At this stage, the lack of a structured, governed data foundation is the primary barrier. Power BI can visualize chaos, but it can’t inherently create order without addressing the source data structure.
2. The growth stage: the “Report Factory” and integration attempts
- Characteristics. Attempts are made to integrate data from multiple sources. Shared datasets might emerge, but report creation often outpaces governance. Automation is introduced, but potentially inconsistently.
- Core Challenges. Significant report sprawl – dozens or hundreds of reports with overlapping information and questionable usage. Performance degradation as models become unwieldy or data volumes increase without optimization. Maintaining consistent business logic across reports becomes a major hurdle. The first signs of Architectural Drift appear as quick fixes compromise design integrity.
- Expert Observation. This is the critical juncture where the absence of a well-designed central data repository, like a dimensional data warehouse adhering to Kimball or Inmon principles, creates significant friction, hindering scalability and reliability.
3. The advanced stage: complex platforms and lingering issues
- Characteristics. An established data warehouse or data platform exists. Power BI connects to curated, modelled data. Advanced analytics or ML initiatives may be underway.
- Core Challenges. Models become overly complex and slow to adapt to changing business requirements. Performance tuning becomes a constant battle. Ensuring true, governed self-service BI without compromising data integrity remains difficult. Semantic consistency across increasingly sophisticated use cases can erode.
- Expert Observation. Even with significant infrastructure investments, neglecting core principles like conformed dimensions, metadata management, and robust data governance frameworks leads to diminishing returns and user frustration.
Architectural drift: when best practices are compromised
A common thread across maturing organizations is Architectural Drift. This is the gradual, often unintentional, deviation from sound BI/DW architectural principles and best practices. It happens under pressure for quick results, fragmented development efforts, or a lack of deep expertise in foundational concepts like dimensional modelling, ETL/ELT discipline, and robust governance. This drift inevitably leads to increased technical debt, higher maintenance costs, reduced agility, and exacerbates the very trust and usability issues BI aims to solve. Getting back on track often involves revisiting and reapplying these proven methodologies.
Realigning with foundational principles
Addressing the challenges outlined above rarely involves simply adopting more tools. The solutions are typically found by stepping back and applying established BI/DW best practices:
- For inconsistent data and trust issues (Initial Stage). Implementing basic data profiling, cleansing, and establishing even a simple, well-structured data mart can provide immediate improvements in consistency.
- For report sprawl and scalability (Growth Stage). Designing and implementing a dimensional data warehouse provides a “single version of the truth,” simplifies reporting logic, improves performance, and enables scalable, governed BI. Consolidating redundant reports becomes feasible.
- For complexity and performance (Advanced Stage). Optimizing the existing data warehouse/platform, refining ETL/ELT processes, strengthening governance, and implementing robust metadata management are key. Sometimes, modernization of the architecture is required.
Self-assessment: Where is your organization?
Evaluate your current BI maturity and challenges with this quick assessment:
Building sustainable BI
Power BI is a capable tool, but its long-term value is inextricably linked to the quality, structure, and governance of the data it consumes. If your organization experiences dashboard proliferation, inconsistent numbers, or eroding trust in your analytics, it’s often a sign that underlying architectural principles have been neglected or compromised by Architectural Drift.
Addressing these core challenges requires expertise in foundational BI and Data Warehousing methodologies. It’s about building sustainable, reliable data structures that deliver consistent, trustworthy insights through tools like Power BI.
If these challenges resonate with your experience, perhaps it’s time for a discussion focused on aligning your BI environment with proven best practices. Contact us to explore how applying established principles can strengthen your data foundation and restore confidence in your analytics.
About Proekspert
Proekspert is a skilled software development company with over 30 years of experience. We have encountered many diverse approaches to equipment, software engineering, and cybersecurity. Our expertise covers embedded software, device-cloud integrations, technician apps, and portals.